 |  |  |
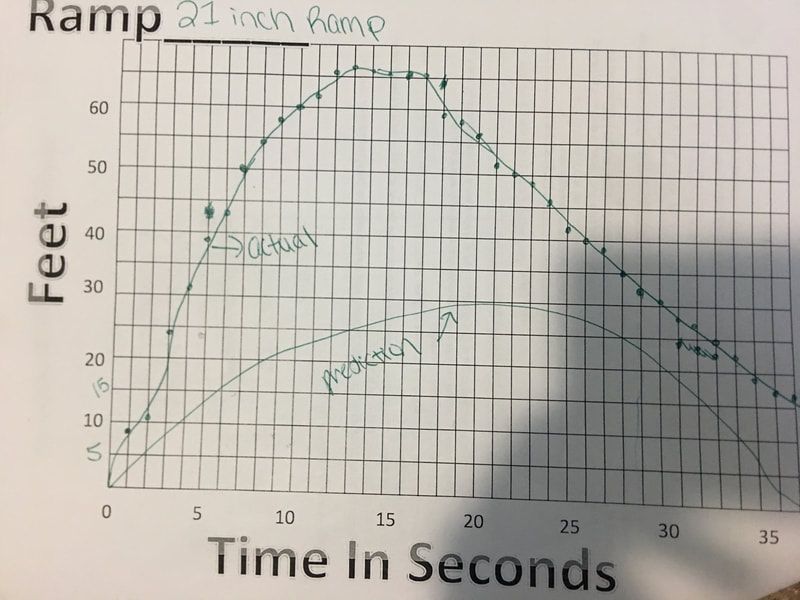
Mr.Cresswell and Mr.Kelly did an experiment using varying heights of skateboard ramps. For each ramp students predicted and then graphed real representations of the skateboard, comparing its time in seconds to feet away from the ramp.
Two out of three graphs i predicted were highly inaccurate. The main reason why there were different was because I underestimated the potential energy that would affect the speed of the skateboard causing it to go further away from the ramp. Originally I believed the friction between the wheels of the skateboard and the pavement would slow down the skateboard more.
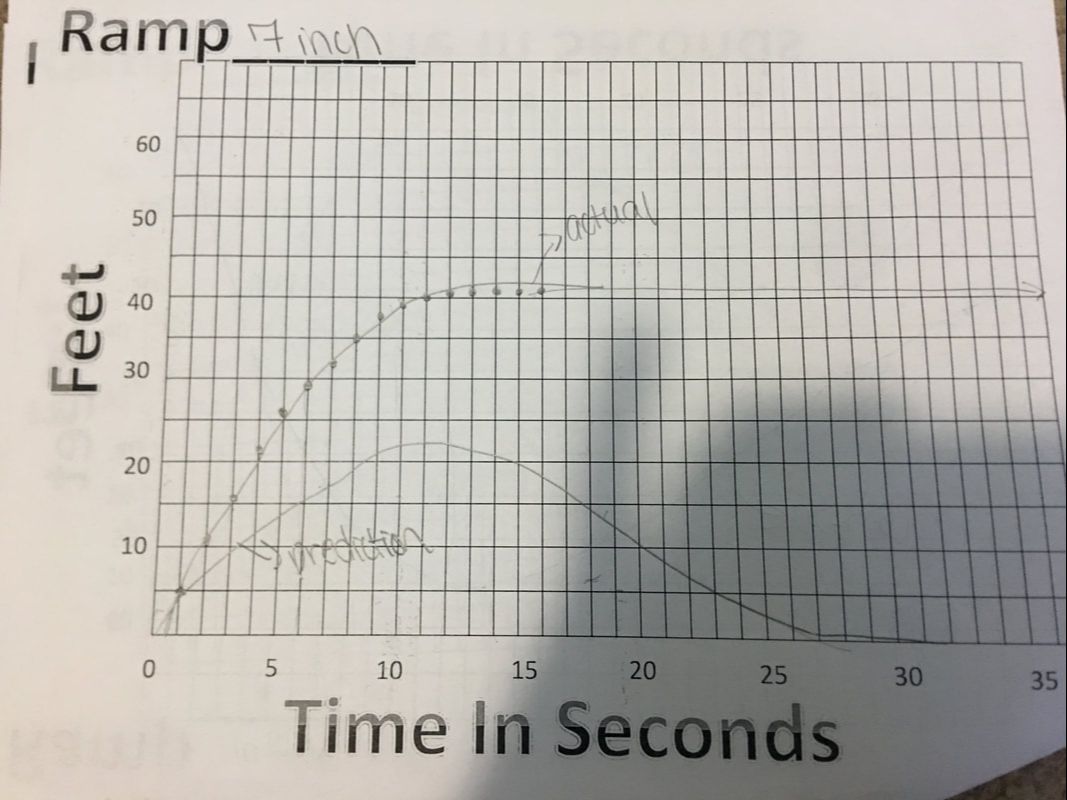
The zeros of the graph represent the skateboards distance away from the ramp. All graphs have a zero starting at the number zero because all skateboard were tested at the same place no matter what size of ramp. There is only one zero graphed on each page either because the skateboard stopped moving, or because the graph wasn't big enough to represent all possible values. All the graphs maximums and minimums varied because of the ramps heights. Each height had a different potential energy at the top of the ramp, when pushed off the ramp varying heights caused gravity to have more or less of a pull on the skateboard. Which caused the 21 inch ramp to travel further than the 7 inch ramp.
Once the skateboard has been pushed off the ramp its initial speed is very great. This causes the slope of the graph when drawn to be the greatest in the first few seconds. The slope of the graph when the skateboard starts rolling backwards is greater in the beginning than it is at the end. This is because as the board travels it loses speed making when the board first starts traveling backwards its greatest slope.
Two out of three graphs i predicted were highly inaccurate. The main reason why there were different was because I underestimated the potential energy that would affect the speed of the skateboard causing it to go further away from the ramp. Originally I believed the friction between the wheels of the skateboard and the pavement would slow down the skateboard more.
The zeros of the graph represent the skateboards distance away from the ramp. All graphs have a zero starting at the number zero because all skateboard were tested at the same place no matter what size of ramp. There is only one zero graphed on each page either because the skateboard stopped moving, or because the graph wasn't big enough to represent all possible values. All the graphs maximums and minimums varied because of the ramps heights. Each height had a different potential energy at the top of the ramp, when pushed off the ramp varying heights caused gravity to have more or less of a pull on the skateboard. Which caused the 21 inch ramp to travel further than the 7 inch ramp.
Once the skateboard has been pushed off the ramp its initial speed is very great. This causes the slope of the graph when drawn to be the greatest in the first few seconds. The slope of the graph when the skateboard starts rolling backwards is greater in the beginning than it is at the end. This is because as the board travels it loses speed making when the board first starts traveling backwards its greatest slope.
 RSS Feed
